{{item.title}}
{{item.text}}

{{item.text}}
The client needed a highly customizable web-based solution that can drive efficiency and productivity in the data and analysis needed to enable great insights. This business intelligence tool was developed to integrate, manipulate, and perform simple to very complex visualization of data from different sources.
Sector: Tax Services
Period work performed: May 2020 – Sep 2020
In this engagement we formed a multidisciplinary team including business consultants, UX/UI specialists, software developers and software quality assurance specialists to analyze, design, develop and successfully deliver a solution that would meet client’s expectations, expressed through its requirements. It was used an agile approach consisting in a set of sprints, each delivering a set of high valued features that, in the end of the final sprint would make the solution. The sprints were planned based on the cost/benefit of the features represented on the products backlog. To be ready for development, each feature would have to pass through a business requirement analysis, a UX/UI design and a technical specification. The sprint itself consisted in the development and tests of the features planned. The technology used was Outsystems as a development platform and Jira as a project management support platform.
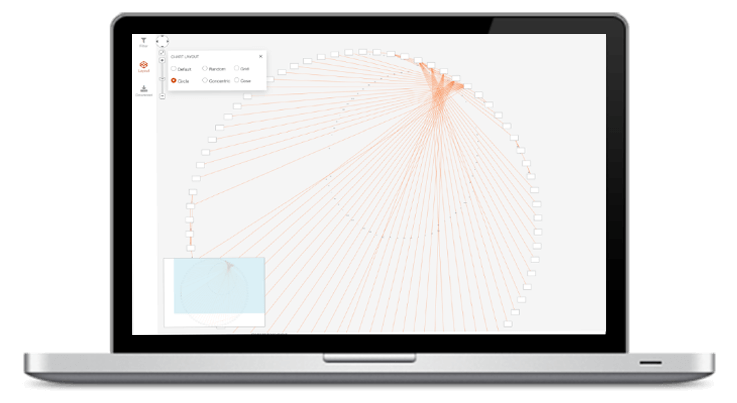
The web solution developed is highly customizable and adaptable not only to the visualization of business organizational charts but also to any data based on nodes and connections. In this way, this solution can boost efficiency in the analysis of large volumes of data with these characteristics, and draw actionable knowledge.
Customizable and adaptable web solution that allows the visualization of any data based on nodes and connections.
Security by design, allows you to ensure that access to each view is only done by users with privileges to do so.
Different styles of nodes and connections can be applied to the same view through the configuration of tags.
Application of filters, data export in various formats (PNG, JPG, JSON, SVG and Excel) and even the change of layouts dynamically applied to each view.
Navigation based on nodes and selected connections (collapse, drill down, highlight, network path).
Comparison between two views with highlight of the changes.
{{item.text}}

{{item.text}}

